Gallery: HS-AFM Images
This website is dedicated to beta-testers of our Ultra-Short Cantilevers and their research as well as to all groups working on High Speed Scanning AFM worldwide. It should serve as a platform where everyone who is interested can show and observe what is possible with High Speed AFM (HS-AFM).
You are all cordially invited to participate in this site. If you have interesting images, videos, papers to share with others please feel free to contact: info@highspeedscanning.com.
If you would like to participate in the beta-testing of our probes for high-speed scanning please contact: info@highspeedscanning.com.
Images:
 250×250 nm2 and (b) 400×400 nm2")
HS-AFM Images of actin filaments on Mica with APTES. Buffer:100 mM KCl, 2 mM MgCl2, 1 mM EGTA, 20 mM Imidazole-HCl, pH7.6 (a) 250×250 nm2 and (b) 400×400 nm2. Image courtesy of Prof. Kodera, nanoLSI, Kanazawa University, Japan.

PM-AFM images of the cleaved calcite surface obtained in water. The images are selected from 44 successive images obtained at 1 s/frame. (a) 0 s. (b) 5 s. (c) 10 s. (d) 15 s. Scan size: 10 nm x 5 nm. Scan rate: 100 Hz. Pixel size: 200 pixels x 100 pixels. The images were obtained with distance feedback regulation in the constant phase shift mode AFM. Thus, they represent the surface height variation. The images show that the calcite step grows from the right to the left.
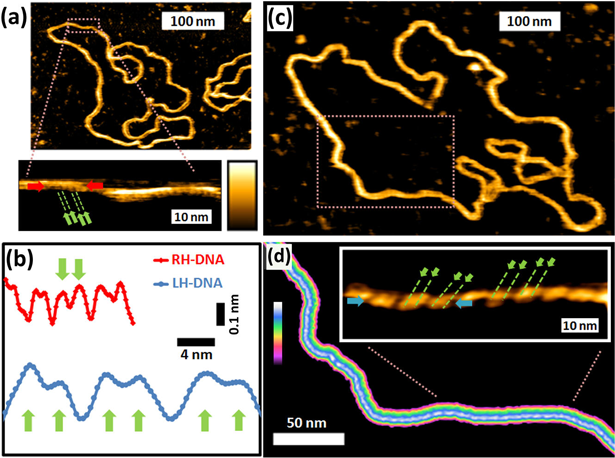
High-resolution AFM on plasmid DNA. (a) 3486 bp plasmid DNA, which on magnification shows a right-handed double helix, superposed to substantial height differences on and along the DNA. (b) Profiles along right-handed (RH) and left-handed (LH) DNA, acquired along the lines marked by the red and blue arrows in the insets of A and D. (c) Elongated configuration of the 3486 bp plasmid DNA displayed at the same scale as part a. (d) On subsequent magnifications of the dashed rectangle in c, an elongated left-handed double helix is resolved. Color scale: 1.5 nm (a); 1.1 nm (a, inset); 1.5 nm (c); 1.1 nm (d); 0.7 nm (d, inset). Green arrows indicate the two strands of the double helix, separated by the minor groove (depth ≤ 0.1 nm). The major groove (depth ∼0.2 nm) separates the subsequent turns of the double helix.
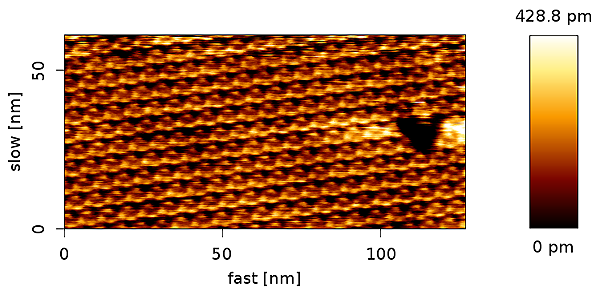
High resolution AFM image of bacteriorhodopsin taken in dynamic mode AFM with an oscillation amplitude of 0.8 nm. The scan size was 127 nm x 62 nm (495 x 200 pixels) and the line rate was 7 Hz. The AFM cantilever used for this application was a NanoWorld USC-F2-k3 AFM probe (10 μm long, 5 μm wide and 280 nm thick) which has a resonance frequency of 2 MHz in air (1.1 MHz in buffer solution) and a force constant of 3 N/m.
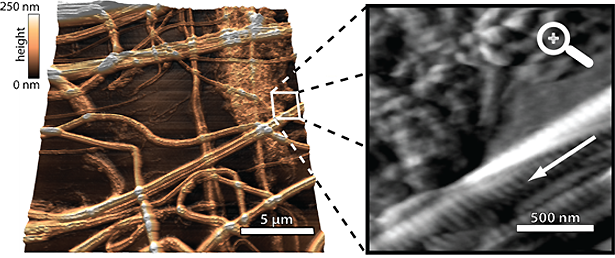
High-speed contact mode AFM image of collagen fibrils in air with a line rate of 210 Hz and scan size of 21 µm × 21 μm. A small silicon nitride AFM cantilever with a length of 20 µm, a width of 2.5 µm, and a resonance frequency of 2.2 MHz was used. Its AFM tip moved with a velocity of 8.8 mm/s relative to the sample surface. (a) 3D-rendered topography. The image was recorded with a very high resolution of 2000 × 2000 pixels. (b) Off-line zoom-in into the framed area in (a). The corresponding deflection instead of the topography is shown here. The 67 nm bending pattern of the collagen fibrils can be clearly identified (arrow).
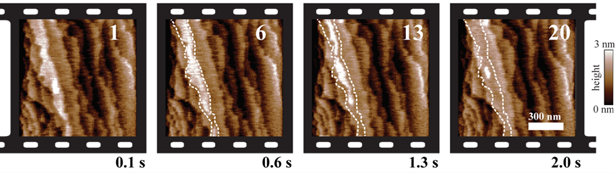
High-speed AFM image sequence of calcite dissolution in diluted hydrochloric acid at a rate of 10 images/s with a small silicon AFM cantilever (length 18 µm, width 4.5 µm, resonance frequency 1.1 MHz in air and 440 kHz in water, spring constant 1.0 N/m). Four topography images of a sequence of 20 are shown. 100 lines of 400 pixels each were recorded for each image, corresponding to a line rate of 1.0 kHz. Calcite dissolution occurs mainly at the edges of the 3 Å high molecular layers. The edges of the upper calcite layer in frame 1 are marked by dashed lines in the other frames. Scan size: 1 µm × 1 µm.
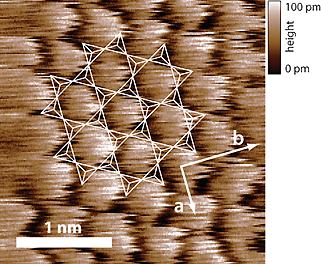
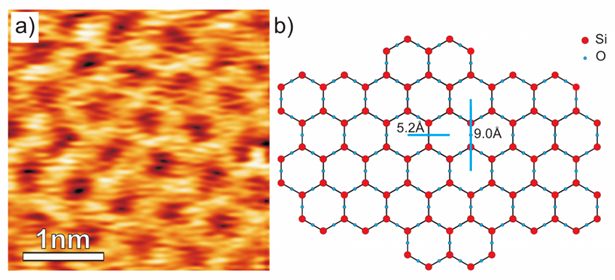
Contact mode AFM image of the muscovite mica {001} cleavage plane in water. A small silicon nitride AFM cantilever with a length of 20 µm, a width of 7.5 µm, a resonance frequency of 641 kHz in air and 322 kHz in water, and a spring constant of 0.7 N/m was used. The image was taken with a scan size of 2.8 nm × 2.8 nm and a line rate of 63 Hz. The contrast in the height image is enhanced by atomic stick-slip friction. The hexagonal lattice structure of the cleavage plane can be clearly identified (a ≈ 5.2 Å, b ≈ 9.0 Å). The arrangement of the SiO4 and AlO4- tetrahedrons is indicated by small white triangles.
a) FM AFM topography image of a freshly cleaved mica in solution (150 mM KCl and 20 mM Tris-HCl in 18.2 MΩ DI water). The image was acquired with a NanoWorld Arrow™ UHF AFM cantilever (f0 = 511.9 kHz, setpoint = +1650 Hz, A = 1.58 nm, tip speed = 160 nm/s, scan size = 3.5 nm x 3.5 nm, Z-scale = 83 pm)
b) Ball-and-stick model of the mica surface